Reporting in a different currency than the given data is a common pattern in BI. Or just the given data is comprised from different values in more currencies and the client want a consolidated view of the amounts.
There is more than one way to tackle this pattern. Today we’ll look at two ways to model the data.
First to discuss the input. We are most likely to get the main Sales / Financial data in different currencies with the amount sold and the date sold.

Secondly, we will get the exchange rate data (or may be instructed where to get for the BI app).

With these two ‘tables’ we have what we need to complete a Reporting Currency BI app. The next question is how to model the data.
The first way is to create some helper tables for the relationship in Power BI to work without problems. And we compute the tables with tese DAX code:
Exchange Date =
DISTINCT ( Sales[Date] )
Exchange Currency =
DISTINCT ( Sales[Currency] )
Reporting Currency =
DISTINCT ( ExchRates[Reporting Currency] )
Creating these tables and connecting them in between would look like:

We have two dimensions in our fact table (Date and Currency), therefore we need two connections to filter those to the right/current exchange rate. The reporting currency table is just a helper table visible to the user to select the currency for the report.
And the Total Amount dax calculation would go for every sale and re-calculate it for the chosen reporting currency.
Total Amount =
SUMX (
Sales;
[Sales]
* CALCULATE (
MAX ( ExchRates[Factor] );
TREATAS ( VALUES ( Sales[Currency] ); ExchRates[TransactionCurrency] )
)
)
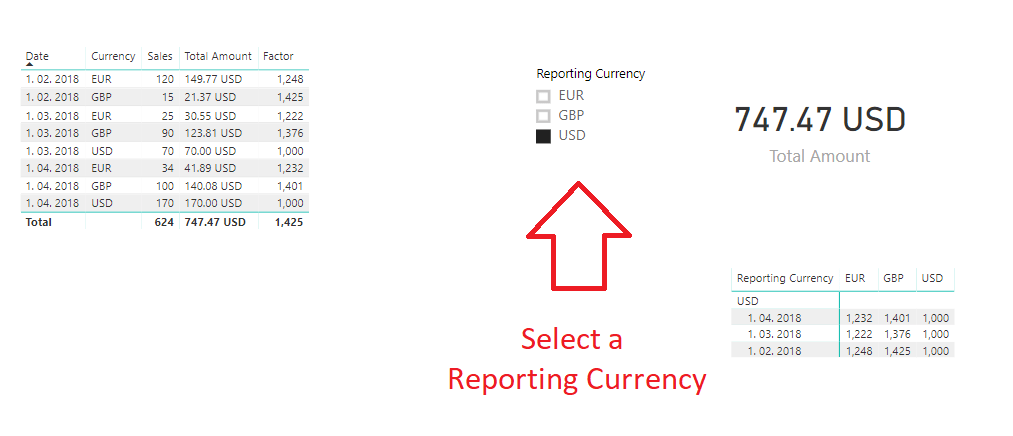
Putting the values in a report table and would look like this

Provided we have the exchange rates for all the sale dates we will get the right amount in the chosen reporting currency.
But let us explore another possibility to model the same problem (or data), which involves a little bit more DAX code and also covers the instance in case the exchange rate data is missing some data point in the middle!
We have the same two input tables (Sales and Exchange Rates), but this time we will do no relationships in the data model. Will try to address the connections with DAX code (can be done!).
The data model is as follows:

(ok, one connection for the Reporting Currency table for the user…)
All the logic will lay in Total Amount calculation:
Total Amount =
SUMX ( Sales; [Sales] * [Factor] )
Ok, and the Factor calculation:
Factor =
VAR lastExchDate =
CALCULATE (
MAX ( ExchRates[Date] );
FILTER ( ExchRates; ExchRates[Date] <= SELECTEDVALUE ( Sales[Date] ) )
)
RETURN
LOOKUPVALUE (
ExchRates[Factor];
ExchRates[TransactionCurrency]; SELECTEDVALUE ( Sales[Currency] );
ExchRates[Date]; lastExchDate;
ExchRates[Reporting Currency]; SELECTEDVALUE ( ‘Reporting Currency'[Reporting Currency] )
)
Some DAX logic, huh?
Yes, but ‘explainable’. The ‘Factor’ calculation is just getting the last available ‘exchange rate’ for computation.
Explaining a bit more in DAX terms, first, in the variable we get the last exchange date (in case on the date of the sale we do not have an exchange rate in the table, so we select the last available one). Secondly, we calculate the factor from the Exchange Rates table, simulating the relationships (or just looking up for the right value as the function name suggests).
Voila!

*The Total Amount is not exactly the same as in the previous example, because we are missing a exchange rate in the middle. But this solution is covering this hole in data!
You can download the sample files here:

Leave a comment