Creating snapshot table in BI is always a non-trivial task.
In SQL Server 2012 and on creating snapshot tables is little more straightforward.
Using the so-called window functions, the code is less verbose thus for the developer to write and more importantly, the operation is more efficient thus faster.
Creating snapshot tables in SQL Server in another post.
On the other hand, creating snapshot tables in the BI world should be little simpler.
At least logically.
And I think it is.
Let us think what we would need in theory, first.
We would need a to compute the a measure, i.e. Inventory Quantity (Amount and/or any other value) for each day of the ‘observed’ time period.
And for every item that we have.
(For the demo we will stick to just these dimensions, but it could also be location-warehouse, etc.)
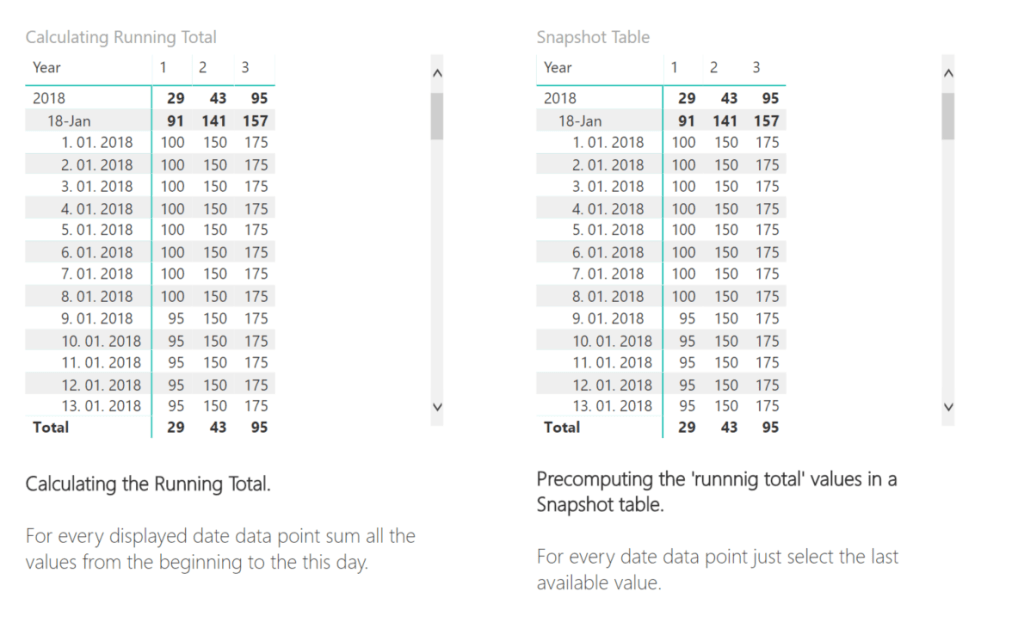
And we can do this in two ways:
- computing a running total for every selection
- pre-computing a snapshot table with all possible values (and just fetching the selected one/-s)
1. Writing a running total measure

The measure as we explained calculates the total from the beginning till the selected date. – time intelligence pattern
Using ‘ALLNOBLANKROW’ instead of ‘ALL’, will solve your “Circular Dependency” errors like this…

2. DAX for the Calculated table (snapshot)

These DAX expression is a ‘table expression’ (as opposed to the previous ‘measure expression’).
And putting theory into practice, cross joining all the data values with the available items and computing the values of inventory. As a result we get a table:

And to have a full detailed post about semi-additive measures, let’s also explain how we select the values from the Snapshot table.
A foolproof option is to always use a so called Last Non Empty measure or in Power BI it would be called Last Non Blank. And it does what the name says it selects the last available value that is not blank (or missing).
This method will still show the right number even if the stock did not change for every date, meaning we may not have values for all date but only for value changes (a method used to save space by having as less rows as possible, but full information).
We write the DAX formula for this calculation as follows:

We calculate the sum of units of the last date available. So, we sum the values of different items, but do not sum from all the dates before.
You can also download the .pbix from gihub.
Power BI has come a long way from where it started (only as a Excel add-on). It has a very versatile and powerful in-memory calculation engine called the DAX engine (or xVelocity more technically). I have been using Power BI to gain insights from its inception, year 2015.

Leave a comment