There are three main points of advantages in using aggregations (what we can get from the official documentation):
- Better query performance over big data
- Optimized data refresh
- Balanced architectures
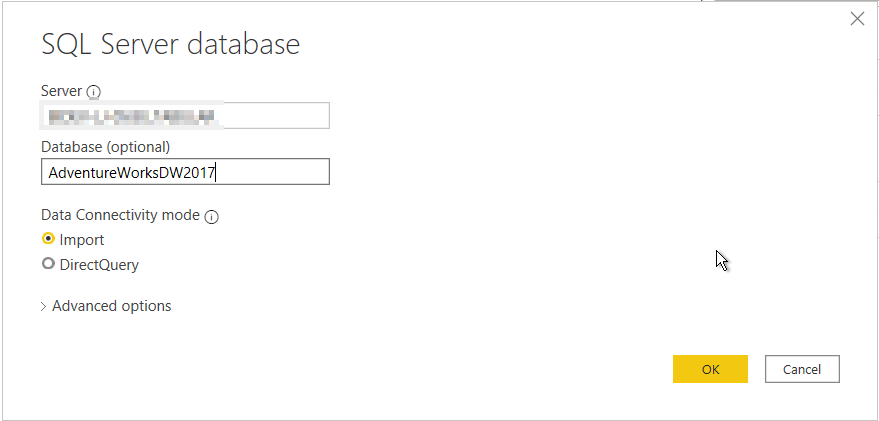
First, I connet to the AdventureWorksDW database.
We choose a couple of tables (fact + dimension):
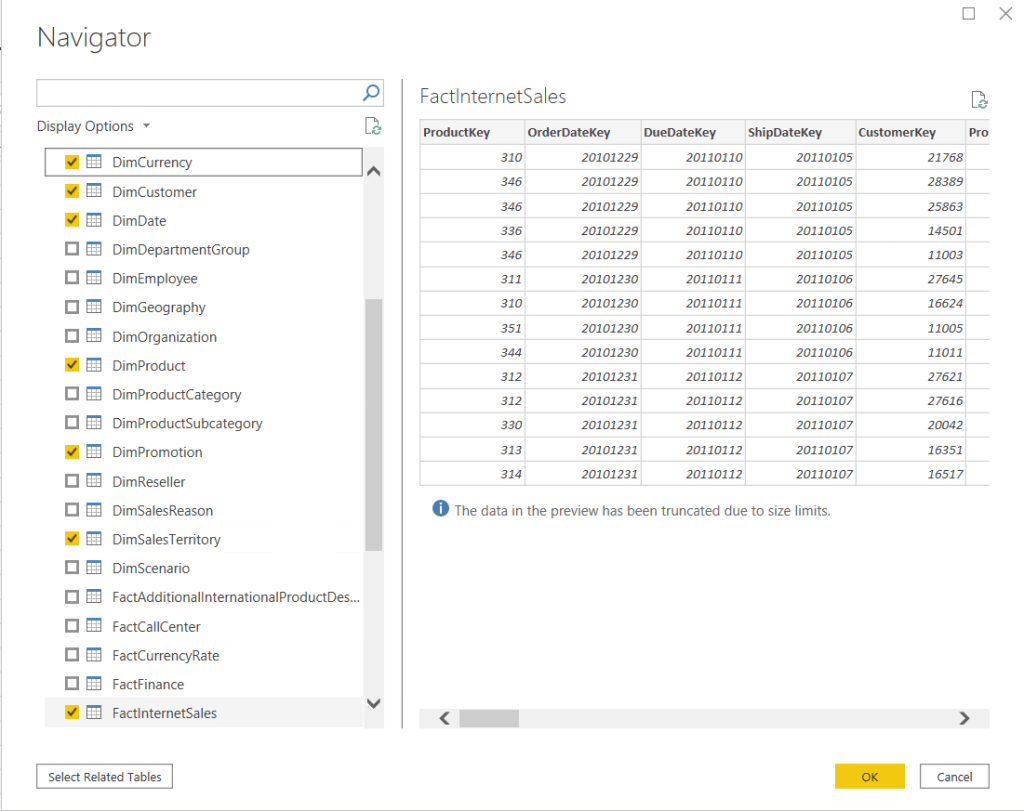
Connect the tables into a data model

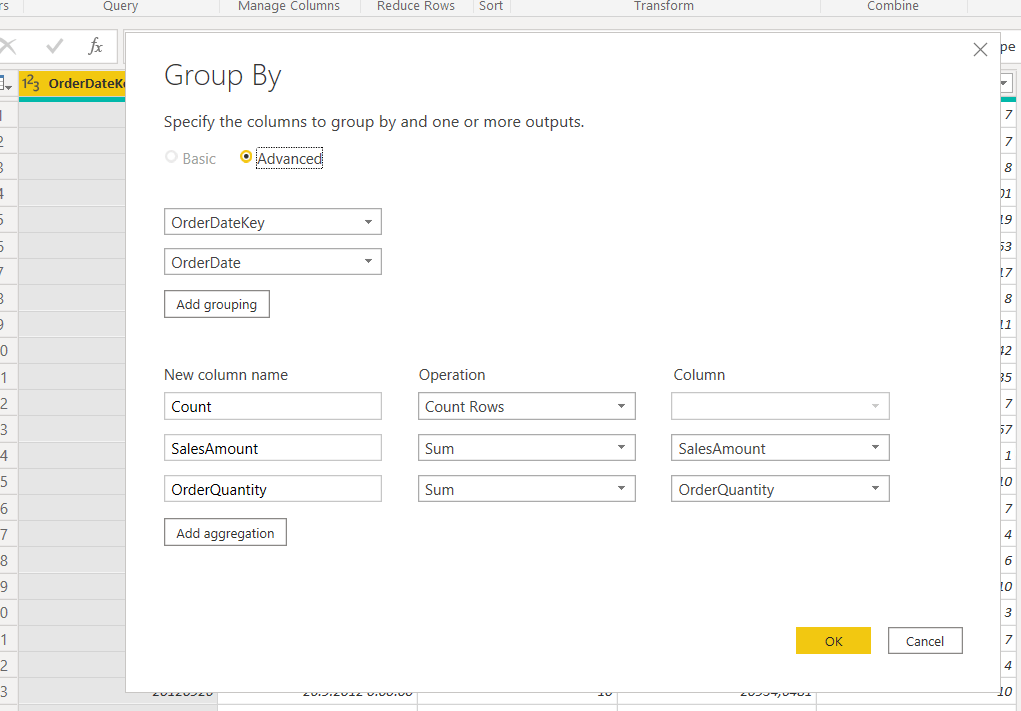
Now, to have an aggregation table, that the engine will choose to calculate the data from memory, we have to import it. Head back to the Query editor and make a table of a granularity (group by columns) that will server as the aggregations table.
I have duplicated the FactInternetSales table query and grouped it by day (to make the aggregations table).
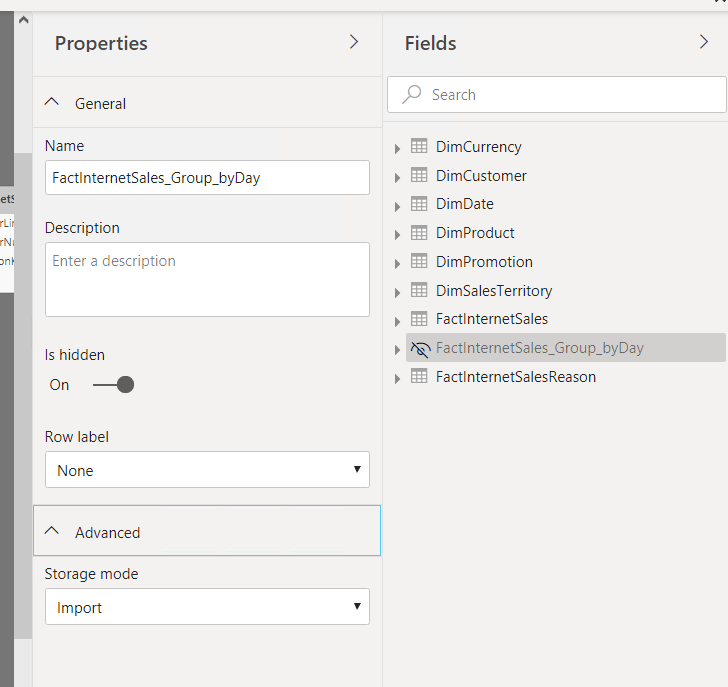
Next, load up all data and set this table to import.
If you have by mistake set the import mode to DirectQuery, go to Relationship View, select the table and under Advanced you will find the property Storage mode, which has to be set to Import.
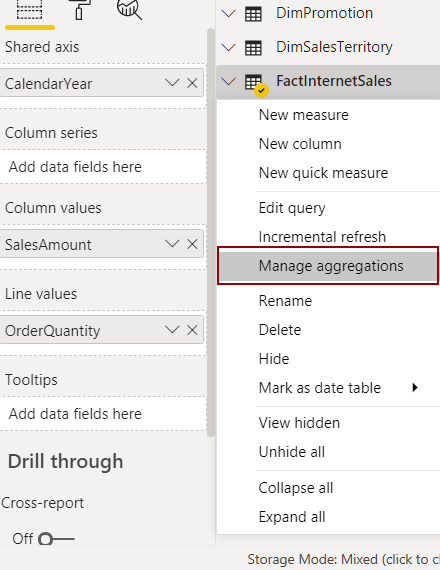
Next up, for setting up the aggregations table we need to configure it by right-clicking on the table and select the option Manage aggregations.
The aggregation table (when set) is automatically hidden and all the engine logic of when to choose the aggregations table vs the details table is also automatic as well! You’ll see in the next steps.
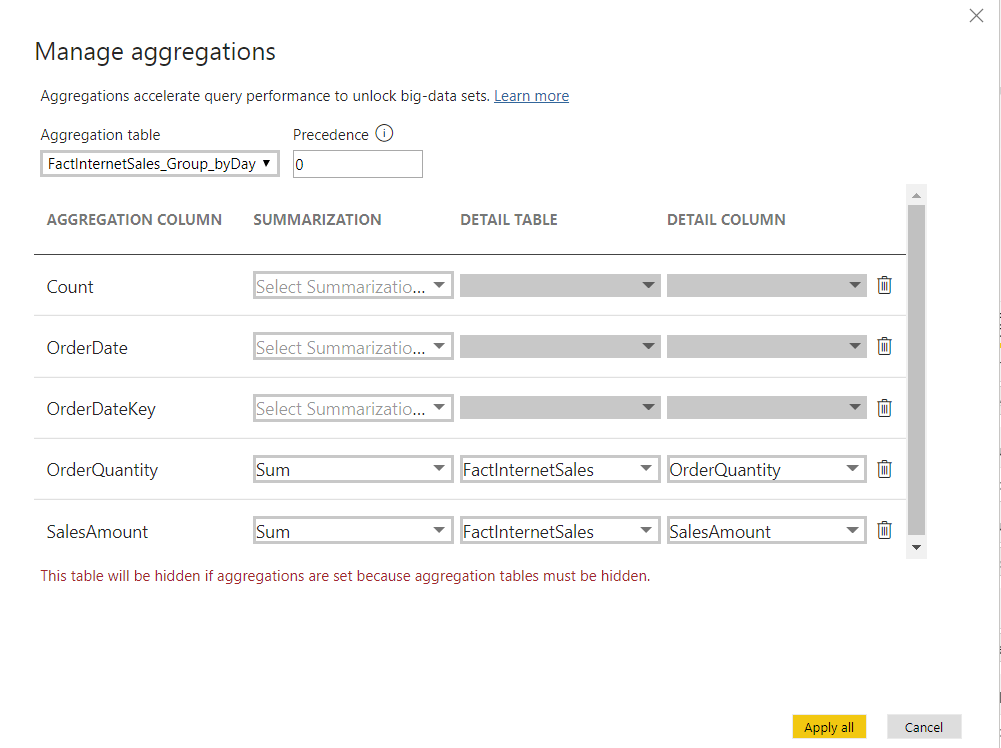
On the manage aggregations window we have to set the to which columns of (which) detail table refers to and its summarization type (i.e. sum). Set the OrderQuantity and SalesAmount to the same named columns from the FactInternetSales table, summarization type Sum of course.
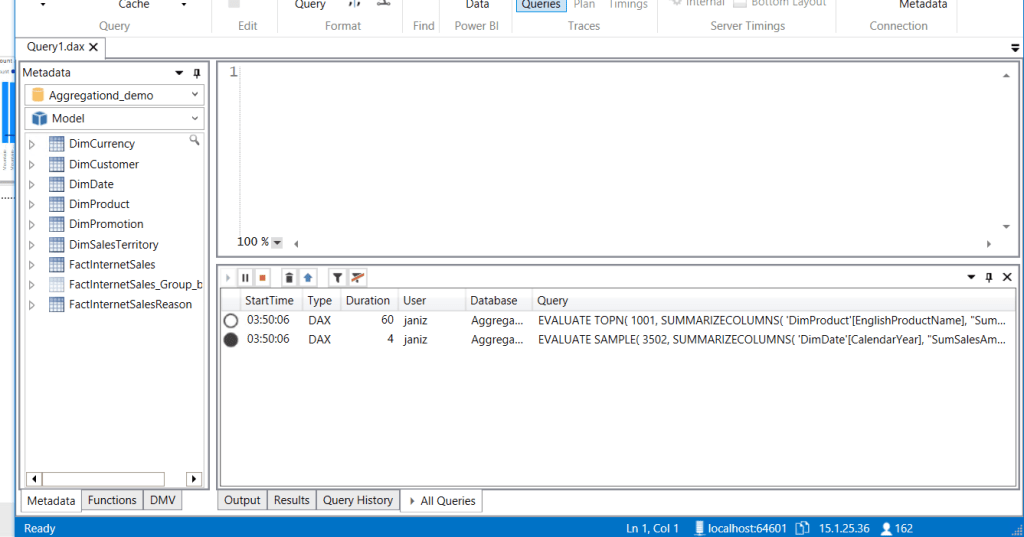
Then, open DAX Studio (if you don’t yet have it, now is the time to install) and go to the Report view to create a visual, say SalesAmount by Year. Oh, opening DAX Studio you have to connect to your model and enable listening to All Queries.
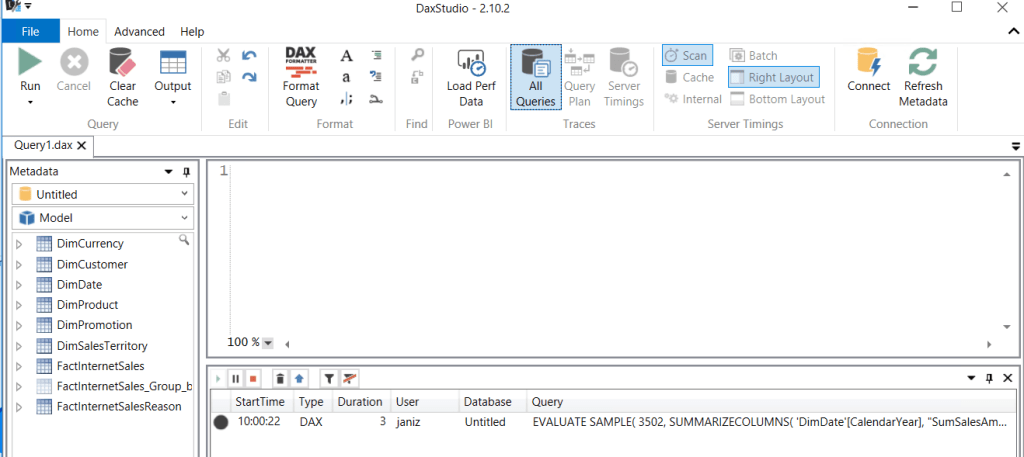
You will probably find that a row in DAX Studio has pop up at the bottom part – that is the query of the visual. If you have done everything right, by hoovering over with the mouse of the black dot you will see that you hit an aggregate. This is what we wanted!
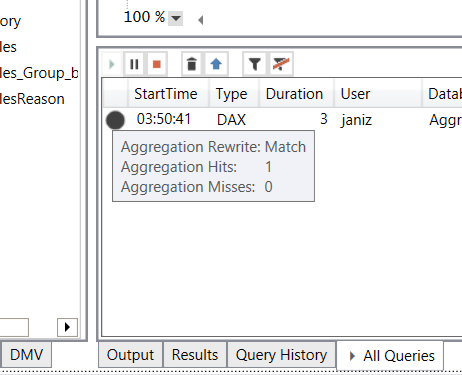
Similarly if you create another visual that is say SalesAmount by Product (or by any other dimension) you will reach an aggregate miss. I have created two such visuals: one that hits the aggregations, and another that does not hit current aggregations.
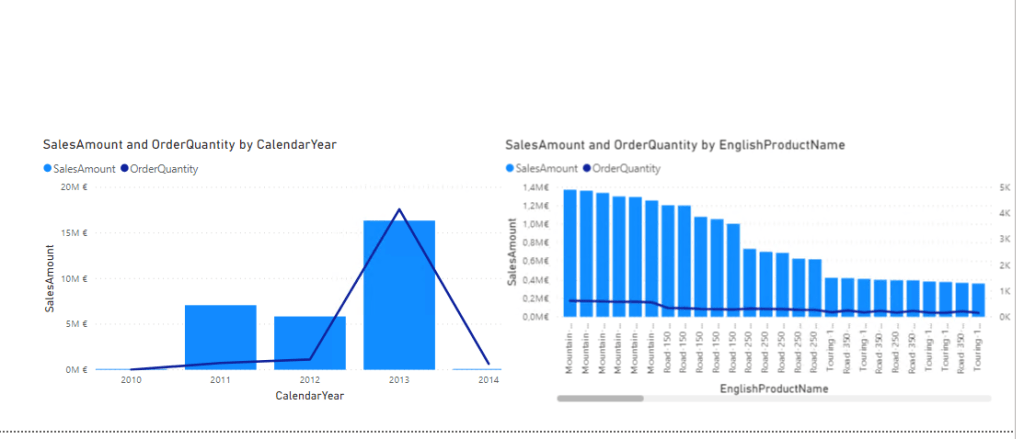
Respectively, two queries one with the aggregation hit and another that went through DirectQuery technology to the database.
There you have it! You have used the aggregation feature like and see that is a piece of cake.
An interesting thing would be seeing aggregation for in-memory data sources, which you already can handle with calculated tables and some if logic within DAX measures. However, through an advanced feature like aggregations in Power BI would benefit us all the most.

Leave a comment