Quite some time ago, before all the improvements of DAX, I wrote a post on how to create a Pareto chart in Power BI. Now, it’s time for a re-run with the more recent features of DAX, mainly window functions!
So, let’s try to write the Pareto cumulative sum of a metric (in the example below, it is sales). Basically, I like CALCULATE-style metrics, possibly one-liners for easy understanding. And as you can see below, we could just do it this way! 🙂
Pareto cumulative = CALCULATE([TotalSales], WINDOW(1, ABS, 0, REL, orderby(Store[Name], ASC) ) )A little explanation of the DAX logic is that we are calculating the [TotalSales] with one 1 context modifier, which is the WINDOW function. The WINDOW function is a function from the ‘window’ set of functions (also INDEX and OFFSET), but it is the most dynamic. Basically, it allows you to set from ‘where’ and ‘to where’ in terms of rows based on the current row, of course. The technical details of how the ‘window’ functions in DAX work are a bit more complex, but for this example, the explanation should suffice.
So, to recap, it calculates the Total Sales from the 1st row (1, ABS) to the current row (0, REL), where ABS stands for absolute and REL for relative, ordered by the Store name ascendingly (ASC). Pretty straightforward, right?
Adding this calculation to a visual
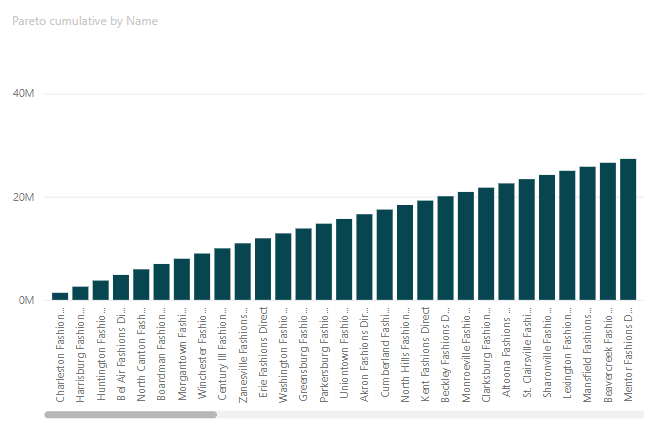
It’s increasing and looks right. Double-checking the numbers in a table, the visuals show the calculation is ok!
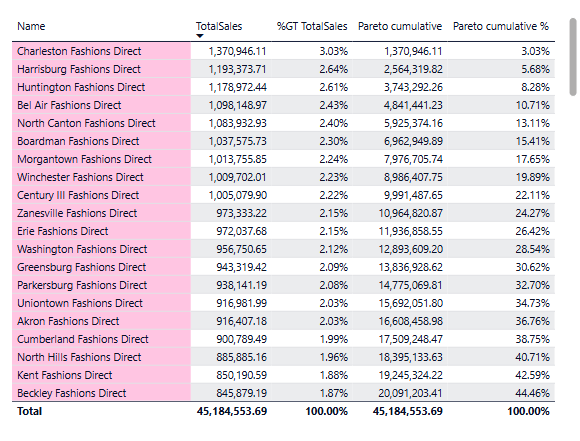
Additionally, what could be added is the Pareto%, which shouldn’t be too hard. We just divide the cumulative Pareto value by the Total sales for all the Pareto dimensions, in this case Total sales for all the Stores, and voila.
Pareto cumulative % =
DIVIDE(
    [Pareto cumulative]
    , CALCULATE([TotalSales], ALL(Store))
)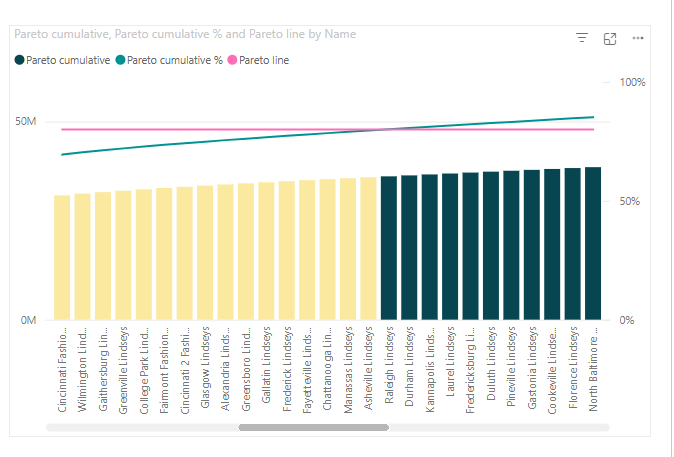
What is more, we can play around with the conditional formatting a bit, like so that all stores (from the one with the biggest Total sales) till 80% of the overall Total sales, so we see them more distinctly, and then we could do additional analysis on those:
- How many are stores compared to all stores?
- What products do these stores sell mostly (again applying Pareto principle on the Item dimension)?
- Do different stores have different top-selling items?
- Are the top items the same every month, or do they change a lot? Seasonal items?
- etc.
ps: a more detail and advanced Pareto calculation you can find over at sqlbi.com site

Leave a comment