For this demo project with Reckitt, I designed a Sales Performance Dashboard that transforms raw data into clear, actionable insights.
The dashboard provides:
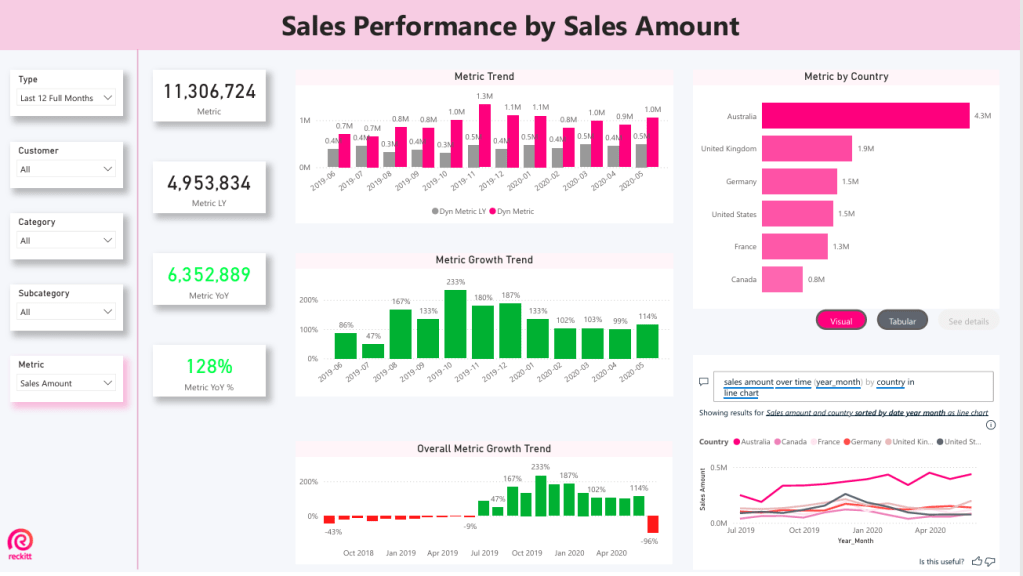
- At-a-glance KPIs such as total sales, year-over-year growth, and customer metrics
- Trends over time with monthly breakdowns and growth tracking
- Geographical insights to identify top markets by country and region
- Customer and product performance to highlight both best and worst performers
The goal was to give decision-makers a tool that is not only visually engaging but also strategically useful, enabling them to spot opportunities, track performance, and drive growth.
Even though this was a non-production test, it shows my ability to translate business objectives into an intuitive and visually engaging dashboard that helps stakeholders make smarter decisions.


Leave a comment